1 #![warn(missing_docs)] 2 /*! 3 4 # Plotters - A Rust drawing library focusing on data plotting for both WASM and native applications ������ 5 6 <a href="https://crates.io/crates/plotters"> 7 <img style="display: inline!important" src="https://img.shields.io/crates/v/plotters.svg"></img> 8 </a> 9 <a href="https://docs.rs/plotters"> 10 <img style="display: inline!important" src="https://docs.rs/plotters/badge.svg"></img> 11 </a> 12 <a href="https://docs.rs/plotters"> 13 <img style="display: inline!important" src="https://img.shields.io/crates/d/plotters"></img> 14 </a> 15 <a href="https://plotters-rs.github.io/rustdoc/plotters/"> 16 <img style="display: inline! important" src="https://img.shields.io/badge/docs-development-lightgrey.svg"></img> 17 </a> 18 19 Plotters is a drawing library designed for rendering figures, plots, and charts, in pure Rust. Plotters supports various types of back-ends, 20 including bitmap, vector graph, piston window, GTK/Cairo and WebAssembly. 21 22 - A new Plotters Developer's Guide is a work in progress. The preview version is available [here](https://plotters-rs.github.io/book). 23 - Try Plotters with an interactive Jupyter notebook, or view [here](https://plotters-rs.github.io/plotters-doc-data/evcxr-jupyter-integration.html) for the static HTML version. 24 - To view the WASM example, go to this [link](https://plotters-rs.github.io/wasm-demo/www/index.html) 25 - Currently we have all the internal code ready for console plotting, but a console based backend is still not ready. See [this example](https://github.com/plotters-rs/plotters/blob/master/plotters/examples/console.rs) for how to plot on console with a customized backend. 26 - Plotters has moved all backend code to separate repositories, check [FAQ list](#faq-list) for details 27 - Some interesting [demo projects](#demo-projects) are available, feel free to try them out. 28 29 ## Gallery 30 31 <div class="galleryItem"> 32 <a href="https://plotters-rs.github.io/plotters-doc-data/sample.png"> 33 <img src="https://plotters-rs.github.io/plotters-doc-data/sample.png" class="galleryItem"></img> 34 </a> 35 <div class="galleryText"> 36 Multiple Plot 37 <a href="https://github.com/plotters-rs/plotters/blob/master/plotters/examples/chart.rs">[code]</a> 38 </div> 39 </div> 40 41 <div class="galleryItem"> 42 <a href="https://plotters-rs.github.io/plotters-doc-data/stock.png"> 43 <img src="https://plotters-rs.github.io/plotters-doc-data/stock.png" class="galleryItem"></img> 44 </a> 45 <div class="galleryText"> 46 Candlestick Plot 47 <a href="https://github.com/plotters-rs/plotters/blob/master/plotters/examples/stock.rs">[code]</a> 48 </div> 49 </div> 50 51 <div class="galleryItem"> 52 <a href="https://plotters-rs.github.io/plotters-doc-data/histogram.png"> 53 <img src="https://plotters-rs.github.io/plotters-doc-data/histogram.png" class="galleryItem"></img> 54 </a> 55 <div class="galleryText"> 56 Histogram 57 <a href="https://github.com/plotters-rs/plotters/blob/master/plotters/examples/histogram.rs">[code]</a> 58 </div> 59 </div> 60 61 <div class="galleryItem"> 62 <a href="https://plotters-rs.github.io/plotters-doc-data/0.png"> 63 <img src="https://plotters-rs.github.io/plotters-doc-data/0.png" class="galleryItem"></img> 64 </a> 65 <div class="galleryText"> 66 Simple Chart 67 </div> 68 </div> 69 70 <div class="galleryItem"> 71 <a href="https://plotters-rs.github.io/plotters-doc-data/console-2.png"> 72 <img src="https://plotters-rs.github.io/plotters-doc-data/console-2.png" class="galleryItem"></img> 73 </a> 74 <div class="galleryText"> 75 Plotting the Console 76 </div> 77 </div> 78 79 <div class="galleryItem"> 80 <a href="https://plotters-rs.github.io/plotters-doc-data/mandelbrot.png"> 81 <img src="https://plotters-rs.github.io/plotters-doc-data/mandelbrot.png" class="galleryItem"></img> 82 </a> 83 <div class="galleryText"> 84 Mandelbrot set 85 <a href="https://github.com/plotters-rs/plotters/blob/master/plotters/examples/mandelbrot.rs">[code]</a> 86 </div> 87 </div> 88 89 90 <div class="galleryItem"> 91 <a href="https://plotters-rs.github.io/plotters-doc-data/evcxr_animation.gif"> 92 <img src="https://plotters-rs.github.io/plotters-doc-data/evcxr_animation.gif" class="galleryItem"></img> 93 </a> 94 <div class="galleryText"> 95 Jupyter Support 96 </div> 97 </div> 98 99 <div class="galleryItem"> 100 <a href="https://plotters-rs.github.io/plotters-doc-data/plotters-piston.gif"> 101 <img src="https://plotters-rs.github.io/plotters-doc-data/plotters-piston.gif" class="galleryItem"></img> 102 </a> 103 <div class="galleryText"> 104 Real-time Rendering 105 <a href="https://github.com/plotters-rs/plotters-piston/blob/master/examples/cpustat.rs">[code]</a> 106 </div> 107 </div> 108 109 <div class="galleryItem"> 110 <a href="https://plotters-rs.github.io/plotters-doc-data/normal-dist.png"> 111 <img src="https://plotters-rs.github.io/plotters-doc-data/normal-dist.png" class="galleryItem"></img> 112 </a> 113 <div class="galleryText"> 114 Histogram with Scatter 115 <a href="https://github.com/plotters-rs/plotters/blob/master/plotters/examples/normal-dist.rs">[code]</a> 116 </div> 117 </div> 118 119 <div class="galleryItem"> 120 <a href="https://plotters-rs.github.io/plotters-doc-data/twoscale.png"> 121 <img src="https://plotters-rs.github.io/plotters-doc-data/twoscale.png" class="galleryItem"></img> 122 </a> 123 <div class="galleryText"> 124 Dual Y-Axis Example 125 <a href="https://github.com/plotters-rs/plotters/blob/master/plotters/examples/two-scales.rs">[code]</a> 126 </div> 127 </div> 128 129 <div class="galleryItem"> 130 <a href="https://plotters-rs.github.io/plotters-doc-data/matshow.png"> 131 <img src="https://plotters-rs.github.io/plotters-doc-data/matshow.png" class="galleryItem"></img> 132 </a> 133 <div class="galleryText"> 134 The Matplotlib Matshow Example 135 <a href="https://github.com/plotters-rs/plotters/blob/master/plotters/examples/matshow.rs">[code]</a> 136 </div> 137 </div> 138 139 <div class="galleryItem"> 140 <a href="https://plotters-rs.github.io/plotters-doc-data/sierpinski.png"> 141 <img src="https://plotters-rs.github.io/plotters-doc-data/sierpinski.png" class="galleryItem"></img> 142 </a> 143 <div class="galleryText"> 144 The Sierpinski Carpet 145 <a href="https://github.com/plotters-rs/plotters/blob/master/plotters/examples/sierpinski.rs">[code]</a> 146 </div> 147 </div> 148 149 <div class="galleryItem"> 150 <a href="https://plotters-rs.github.io/plotters-doc-data/normal-dist2.png"> 151 <img src="https://plotters-rs.github.io/plotters-doc-data/normal-dist2.png" class="galleryItem"></img> 152 </a> 153 <div class="galleryText"> 154 The 1D Gaussian Distribution 155 <a href="https://github.com/plotters-rs/plotters/blob/master/plotters/examples/nomal-dist2.rs">[code]</a> 156 </div> 157 </div> 158 159 <div class="galleryItem"> 160 <a href="https://plotters-rs.github.io/plotters-doc-data/errorbar.png"> 161 <img src="https://plotters-rs.github.io/plotters-doc-data/errorbar.png" class="galleryItem"></img> 162 </a> 163 <div class="galleryText"> 164 The 1D Gaussian Distribution 165 <a href="https://github.com/plotters-rs/plotters/blob/master/plotters/examples/errorbar.rs">[code]</a> 166 </div> 167 </div> 168 169 <div class="galleryItem"> 170 <a href="https://plotters-rs.github.io/plotters-doc-data/slc-temp.png"> 171 <img src="https://plotters-rs.github.io/plotters-doc-data/slc-temp.png" class="galleryItem"></img> 172 </a> 173 <div class="galleryText"> 174 Monthly Time Coordinate 175 <a href="https://github.com/plotters-rs/plotters/blob/master/plotters/examples/slc-temp.rs">[code]</a> 176 </div> 177 </div> 178 179 <div class="galleryItem"> 180 <a href="https://plotters-rs.github.io/plotters-doc-data/area-chart.png"> 181 <img src="https://plotters-rs.github.io/plotters-doc-data/area-chart.png" class="galleryItem"></img> 182 </a> 183 <div class="galleryText"> 184 Monthly Time Coordinate 185 <a href="https://github.com/plotters-rs/plotters/blob/master/plotters/examples/area-chart.rs">[code]</a> 186 </div> 187 </div> 188 189 <div class="galleryItem"> 190 <a href="https://plotters-rs.github.io/plotters-doc-data/snowflake.png"> 191 <img src="https://plotters-rs.github.io/plotters-doc-data/snowflake.png" class="galleryItem"></img> 192 </a> 193 <div class="galleryText"> 194 Koch Snowflake 195 <a href="https://github.com/plotters-rs/plotters/blob/master/plotters/examples/snowflake.rs">[code]</a> 196 </div> 197 </div> 198 199 200 <div class="galleryItem"> 201 <a href="https://plotters-rs.github.io/plotters-doc-data/animation.gif"> 202 <img src="https://plotters-rs.github.io/plotters-doc-data/animation.gif" class="galleryItem"></img> 203 </a> 204 <div class="galleryText"> 205 Koch Snowflake Animation 206 <a href="https://github.com/plotters-rs/plotters/blob/master/plotters/examples/animation.rs">[code]</a> 207 </div> 208 </div> 209 210 211 <div class="galleryItem"> 212 <a href="https://plotters-rs.github.io/plotters-doc-data/console.png"> 213 <img src="https://plotters-rs.github.io/plotters-doc-data/console.png" class="galleryItem"></img> 214 </a> 215 <div class="galleryText"> 216 Drawing on a Console 217 <a href="https://github.com/plotters-rs/plotters/blob/master/plotters/examples/console.rs">[code]</a> 218 </div> 219 </div> 220 221 <div class="galleryItem"> 222 <a href="https://plotters-rs.github.io/plotters-doc-data/blit-bitmap.png"> 223 <img src="https://plotters-rs.github.io/plotters-doc-data/blit-bitmap.png" class="galleryItem"></img> 224 </a> 225 <div class="galleryText"> 226 Drawing bitmap on chart 227 <a href="https://github.com/plotters-rs/plotters/blob/master/plotters/examples/blit-bitmap.rs">[code]</a> 228 </div> 229 </div> 230 231 <div class="galleryItem"> 232 <a href="https://plotters-rs.github.io/plotters-doc-data/boxplot.svg"> 233 <img src="https://plotters-rs.github.io/plotters-doc-data/boxplot.svg" class="galleryItem"></img> 234 </a> 235 <div class="galleryText"> 236 The boxplot demo 237 <a href="https://github.com/plotters-rs/plotters/blob/master/plotters/examples/boxplot.rs">[code]</a> 238 </div> 239 </div> 240 241 <div class="galleryItem"> 242 <a href="https://plotters-rs.github.io/plotters-doc-data/3d-plot.svg"> 243 <img src="https://plotters-rs.github.io/plotters-doc-data/3d-plot.svg" class="galleryItem"></img> 244 </a> 245 <div class="galleryText"> 246 3D plot rendering 247 <a href="https://github.com/plotters-rs/plotters/blob/master/plotters/examples/3d-plot.rs">[code]</a> 248 </div> 249 </div> 250 251 <div class="galleryItem"> 252 <a href="https://plotters-rs.github.io/plotters-doc-data/3d-plot2.gif"> 253 <img src="https://plotters-rs.github.io/plotters-doc-data/3d-plot2.gif" class="galleryItem"></img> 254 </a> 255 <div class="galleryText"> 256 2-Var Gussian Distribution PDF 257 <a href="https://github.com/plotters-rs/plotters/blob/master/plotters/examples/3d-plot2.rs">[code]</a> 258 </div> 259 </div> 260 261 <div class="galleryItem"> 262 <a href="https://plotters-rs.github.io/plotters-doc-data/tick_control.svg"> 263 <img src="https://plotters-rs.github.io/plotters-doc-data/tick_control.svg" class="galleryItem"></img> 264 </a> 265 <div class="galleryText"> 266 COVID-19 Visualization 267 <a href="https://github.com/plotters-rs/plotters/blob/master/plotters/examples/tick_control.rs">[code]</a> 268 </div> 269 </div> 270 271 272 ## Table of Contents 273 * [Gallery](#gallery) 274 * [Dependencies](#dependencies) 275 + [Ubuntu Linux](#ubuntu-linux) 276 * [Quick Start](#quick-start) 277 * [Demo Projects](#demo-projects) 278 * [Trying with Jupyter evcxr Kernel Interactively](#trying-with-jupyter-evcxr-kernel-interactively) 279 * [Interactive Tutorial with Jupyter Notebook](#interactive-tutorial-with-jupyter-notebook) 280 * [Plotting in Rust](#plotting-in-rust) 281 * [Plotting on HTML5 canvas with WASM Backend](#plotting-on-html5-canvas-with-wasm-backend) 282 * [What types of figure are supported?](#what-types-of-figure-are-supported) 283 * [Concepts by example](#concepts-by-example) 284 + [Drawing Backends](#drawing-backends) 285 + [Drawing Area](#drawing-area) 286 + [Elements](#elements) 287 + [Composable Elements](#composable-elements) 288 + [Chart Context](#chart-context) 289 * [Misc](#misc) 290 + [Development Version](#development-version) 291 + [Reducing Depending Libraries && Turning Off Backends](#reducing-depending-libraries--turning-off-backends) 292 + [List of Features](#list-of-features) 293 * [FAQ List](#faq-list) 294 295 ## Dependencies 296 297 ### Ubuntu Linux 298 299 ```sudo apt install pkg-config libfreetype6-dev libfontconfig1-dev``` 300 301 ## Quick Start 302 303 To use Plotters, you can simply add Plotters into your `Cargo.toml` 304 ```toml 305 [dependencies] 306 plotters = "0.3.3" 307 ``` 308 309 And the following code draws a quadratic function. `src/main.rs`, 310 311 ```rust 312 use plotters::prelude::*; 313 fn main() -> Result<(), Box<dyn std::error::Error>> { 314 let root = BitMapBackend::new("plotters-doc-data/0.png", (640, 480)).into_drawing_area(); 315 root.fill(&WHITE)?; 316 let mut chart = ChartBuilder::on(&root) 317 .caption("y=x^2", ("sans-serif", 50).into_font()) 318 .margin(5) 319 .x_label_area_size(30) 320 .y_label_area_size(30) 321 .build_cartesian_2d(-1f32..1f32, -0.1f32..1f32)?; 322 323 chart.configure_mesh().draw()?; 324 325 chart 326 .draw_series(LineSeries::new( 327 (-50..=50).map(|x| x as f32 / 50.0).map(|x| (x, x * x)), 328 &RED, 329 ))? 330 .label("y = x^2") 331 .legend(|(x, y)| PathElement::new(vec![(x, y), (x + 20, y)], &RED)); 332 333 chart 334 .configure_series_labels() 335 .background_style(&WHITE.mix(0.8)) 336 .border_style(&BLACK) 337 .draw()?; 338 339 root.present()?; 340 341 Ok(()) 342 } 343 ``` 344 345  346 347 ## Demo Projects 348 349 To learn how to use Plotters in different scenarios, check out the following demo projects: 350 351 - WebAssembly + Plotters: [plotters-wasm-demo](https://github.com/plotters-rs/plotters-wasm-demo) 352 - minifb + Plotters: [plotters-minifb-demo](https://github.com/plotters-rs/plotters-minifb-demo) 353 - GTK + Plotters: [plotters-gtk-demo](https://github.com/plotters-rs/plotters-gtk-demo) 354 355 356 ## Trying with Jupyter evcxr Kernel Interactively 357 358 Plotters now supports integration with `evcxr` and is able to interactively draw plots in Jupyter Notebook. 359 The feature `evcxr` should be enabled when including Plotters to Jupyter Notebook. 360 361 The following code shows a minimal example of this. 362 363 ```text 364 :dep plotters = { version = "^0.3.5", default_features = false, features = ["evcxr", "all_series", "all_elements"] } 365 extern crate plotters; 366 use plotters::prelude::*; 367 368 let figure = evcxr_figure((640, 480), |root| { 369 root.fill(&WHITE)?; 370 let mut chart = ChartBuilder::on(&root) 371 .caption("y=x^2", ("Arial", 50).into_font()) 372 .margin(5) 373 .x_label_area_size(30) 374 .y_label_area_size(30) 375 .build_cartesian_2d(-1f32..1f32, -0.1f32..1f32)?; 376 377 chart.configure_mesh().draw()?; 378 379 chart.draw_series(LineSeries::new( 380 (-50..=50).map(|x| x as f32 / 50.0).map(|x| (x, x * x)), 381 &RED, 382 )).unwrap() 383 .label("y = x^2") 384 .legend(|(x,y)| PathElement::new(vec![(x,y), (x + 20,y)], &RED)); 385 386 chart.configure_series_labels() 387 .background_style(&WHITE.mix(0.8)) 388 .border_style(&BLACK) 389 .draw()?; 390 Ok(()) 391 }); 392 figure 393 ``` 394 395 <img src="https://plotters-rs.github.io/plotters-doc-data/evcxr_animation.gif" width="450px"></img> 396 397 ## Interactive Tutorial with Jupyter Notebook 398 399 *This tutorial is a work in progress and isn't complete* 400 401 Thanks to the evcxr, now we have an interactive tutorial for Plotters! 402 To use the interactive notebook, you must have Jupyter and evcxr installed on your computer. 403 Follow the instruction on [this page](https://github.com/google/evcxr/tree/master/evcxr_jupyter) below to install it. 404 405 After that, you should be able to start your Jupyter server locally and load the tutorial! 406 407 ```bash 408 git clone https://github.com/38/plotters-doc-data 409 cd plotters-doc-data 410 jupyter notebook 411 ``` 412 413 And select the notebook called `evcxr-jupyter-integration.ipynb`. 414 415 Also, there's a static HTML version of this notebook available at [this location](https://plotters-rs.github.io/plotters-doc-data/evcxr-jupyter-integration.html) 416 417 ## Plotting in Rust 418 419 Rust is a perfect language for data visualization. Although there are many mature visualization libraries in many different languages, Rust is one of the best languages that fits the need. 420 421 * **Easy to use** Rust has a very good iterator system built into the standard library. With the help of iterators, 422 plotting in Rust can be as easy as most of the high-level programming languages. The Rust based plotting library 423 can be very easy to use. 424 425 * **Fast** If you need to render a figure with trillions of data points, 426 Rust is a good choice. Rust's performance allows you to combine the data processing step 427 and rendering step into a single application. When plotting in high-level programming languages, 428 e.g. Javascript or Python, data points must be down-sampled before feeding into the plotting 429 program because of the performance considerations. Rust is fast enough to do the data processing and visualization 430 within a single program. You can also integrate the 431 figure rendering code into your application to handle a huge amount of data and visualize it in real-time. 432 433 * **WebAssembly Support** Rust is one of the languages with the best WASM support. Plotting in Rust could be 434 very useful for visualization on a web page and would have a huge performance improvement comparing to Javascript. 435 436 ## Plotting on HTML5 canvas with WASM Backend 437 438 Plotters currently supports a backend that uses the HTML5 canvas. To use WASM, you can simply use 439 `CanvasBackend` instead of other backend and all other API remains the same! 440 441 There's a small demo for Plotters + WASM available at [here](https://github.com/plotters-rs/plotters-wasm-demo). 442 To play with the deployed version, follow this [link](https://plotters-rs.github.io/wasm-demo/www/index.html). 443 444 ## What types of figure are supported? 445 446 Plotters is not limited to any specific type of figure. 447 You can create your own types of figures easily with the Plotters API. 448 449 Plotters does provide some built-in figure types for convenience. 450 Currently, we support line series, point series, candlestick series, and histogram. 451 And the library is designed to be able to render multiple figure into a single image. 452 But Plotter is aimed to be a platform that is fully extendable to support any other types of figure. 453 454 ## Concepts by example 455 456 ### Drawing Backends 457 Plotters can use different drawing backends, including SVG, BitMap, and even real-time rendering. For example, a bitmap drawing backend. 458 459 ```rust 460 use plotters::prelude::*; 461 fn main() -> Result<(), Box<dyn std::error::Error>> { 462 // Create a 800*600 bitmap and start drawing 463 let mut backend = BitMapBackend::new("plotters-doc-data/1.png", (300, 200)); 464 // And if we want SVG backend 465 // let backend = SVGBackend::new("output.svg", (800, 600)); 466 backend.draw_rect((50, 50), (200, 150), &RED, true)?; 467 backend.present()?; 468 Ok(()) 469 } 470 ``` 471 472  473 474 ### Drawing Area 475 Plotters uses a concept called drawing area for layout purpose. 476 Plotters supports integrating multiple figures into a single image. 477 This is done by creating sub-drawing-areas. 478 479 Besides that, the drawing area also allows for a customized coordinate system, by doing so, the coordinate mapping is done by the drawing area automatically. 480 481 ```rust 482 use plotters::prelude::*; 483 fn main() -> Result<(), Box<dyn std::error::Error>> { 484 let root_drawing_area = 485 BitMapBackend::new("plotters-doc-data/2.png", (300, 200)).into_drawing_area(); 486 // And we can split the drawing area into 3x3 grid 487 let child_drawing_areas = root_drawing_area.split_evenly((3, 3)); 488 // Then we fill the drawing area with different color 489 for (area, color) in child_drawing_areas.into_iter().zip(0..) { 490 area.fill(&Palette99::pick(color))?; 491 } 492 root_drawing_area.present()?; 493 Ok(()) 494 } 495 ``` 496 497  498 499 ### Elements 500 501 In Plotters, elements are the building blocks of figures. All elements are able to be drawn on a drawing area. 502 There are different types of built-in elements, like lines, texts, circles, etc. 503 You can also define your own element in the application code. 504 505 You may also combine existing elements to build a complex element. 506 507 To learn more about the element system, please read the [element module documentation](./element/index.html). 508 509 ```rust 510 use plotters::prelude::*; 511 fn main() -> Result<(), Box<dyn std::error::Error>> { 512 let root = BitMapBackend::new("plotters-doc-data/3.png", (300, 200)).into_drawing_area(); 513 root.fill(&WHITE)?; 514 // Draw an circle on the drawing area 515 root.draw(&Circle::new( 516 (100, 100), 517 50, 518 Into::<ShapeStyle>::into(&GREEN).filled(), 519 ))?; 520 root.present()?; 521 Ok(()) 522 } 523 ``` 524 525  526 527 ### Composable Elements 528 529 Besides the built-in elements, elements can be composed into a logical group we called composed elements. 530 When composing new elements, the upper-left corner is given in the target coordinate, and a new pixel-based 531 coordinate which has the upper-left corner defined as `(0,0)` is used for further element composition. 532 533 For example, we can have an element which includes a dot and its coordinate. 534 535 ```rust 536 use plotters::prelude::*; 537 use plotters::coord::types::RangedCoordf32; 538 539 fn main() -> Result<(), Box<dyn std::error::Error>> { 540 let root = BitMapBackend::new("plotters-doc-data/4.png", (640, 480)).into_drawing_area(); 541 542 root.fill(&RGBColor(240, 200, 200))?; 543 544 let root = root.apply_coord_spec(Cartesian2d::<RangedCoordf32, RangedCoordf32>::new( 545 0f32..1f32, 546 0f32..1f32, 547 (0..640, 0..480), 548 )); 549 550 let dot_and_label = |x: f32, y: f32| { 551 return EmptyElement::at((x, y)) 552 + Circle::new((0, 0), 3, ShapeStyle::from(&BLACK).filled()) 553 + Text::new( 554 format!("({:.2},{:.2})", x, y), 555 (10, 0), 556 ("sans-serif", 15.0).into_font(), 557 ); 558 }; 559 560 root.draw(&dot_and_label(0.5, 0.6))?; 561 root.draw(&dot_and_label(0.25, 0.33))?; 562 root.draw(&dot_and_label(0.8, 0.8))?; 563 root.present()?; 564 Ok(()) 565 } 566 ``` 567 568  569 570 ### Chart Context 571 572 In order to draw a chart, Plotters needs a data object built on top of the drawing area called `ChartContext`. 573 The chart context defines even higher level constructs compare to the drawing area. 574 For example, you can define the label areas, meshes, and put a data series onto the drawing area with the help 575 of the chart context object. 576 577 ```rust 578 use plotters::prelude::*; 579 fn main() -> Result<(), Box<dyn std::error::Error>> { 580 let root = BitMapBackend::new("plotters-doc-data/5.png", (640, 480)).into_drawing_area(); 581 root.fill(&WHITE); 582 let root = root.margin(10, 10, 10, 10); 583 // After this point, we should be able to construct a chart context 584 let mut chart = ChartBuilder::on(&root) 585 // Set the caption of the chart 586 .caption("This is our first plot", ("sans-serif", 40).into_font()) 587 // Set the size of the label region 588 .x_label_area_size(20) 589 .y_label_area_size(40) 590 // Finally attach a coordinate on the drawing area and make a chart context 591 .build_cartesian_2d(0f32..10f32, 0f32..10f32)?; 592 593 // Then we can draw a mesh 594 chart 595 .configure_mesh() 596 // We can customize the maximum number of labels allowed for each axis 597 .x_labels(5) 598 .y_labels(5) 599 // We can also change the format of the label text 600 .y_label_formatter(&|x| format!("{:.3}", x)) 601 .draw()?; 602 603 // And we can draw something in the drawing area 604 chart.draw_series(LineSeries::new( 605 vec![(0.0, 0.0), (5.0, 5.0), (8.0, 7.0)], 606 &RED, 607 ))?; 608 // Similarly, we can draw point series 609 chart.draw_series(PointSeries::of_element( 610 vec![(0.0, 0.0), (5.0, 5.0), (8.0, 7.0)], 611 5, 612 &RED, 613 &|c, s, st| { 614 return EmptyElement::at(c) // We want to construct a composed element on-the-fly 615 + Circle::new((0,0),s,st.filled()) // At this point, the new pixel coordinate is established 616 + Text::new(format!("{:?}", c), (10, 0), ("sans-serif", 10).into_font()); 617 }, 618 ))?; 619 root.present()?; 620 Ok(()) 621 } 622 ``` 623 624  625 626 ## Misc 627 628 ### Development Version 629 630 Find the latest development version of Plotters on [GitHub](https://github.com/plotters-rs/plotters.git). 631 Clone the repository and learn more about the Plotters API and ways to contribute. Your help is needed! 632 633 If you want to add the development version of Plotters to your project, add the following to your `Cargo.toml`: 634 635 ```toml 636 [dependencies] 637 plotters = { git = "https://github.com/plotters-rs/plotters.git" } 638 ``` 639 640 ### Reducing Depending Libraries && Turning Off Backends 641 Plotters now supports use features to control the backend dependencies. By default, `BitMapBackend` and `SVGBackend` are supported, 642 use `default_features = false` in the dependency description in `Cargo.toml` and you can cherry-pick the backend implementations. 643 644 - `svg` Enable the `SVGBackend` 645 - `bitmap` Enable the `BitMapBackend` 646 647 For example, the following dependency description would avoid compiling with bitmap support: 648 649 ```toml 650 [dependencies] 651 plotters = { git = "https://github.com/plotters-rs/plotters.git", default_features = false, features = ["svg"] } 652 ``` 653 654 The library also allows consumers to make use of the [`Palette`](https://crates.io/crates/palette/) crate's color types by default. 655 This behavior can also be turned off by setting `default_features = false`. 656 657 ### List of Features 658 659 This is the full list of features that is defined by `Plotters` crate. 660 Use `default_features = false` to disable those default enabled features, 661 and then you should be able to cherry-pick what features you want to include into `Plotters` crate. 662 By doing so, you can minimize the number of dependencies down to only `itertools` and compile time is less than 6s. 663 664 The following list is a complete list of features that can be opted in or out. 665 666 - Tier 1 drawing backends 667 668 | Name | Description | Additional Dependency |Default?| 669 |---------|--------------|--------|------------| 670 | bitmap\_encoder | Allow `BitMapBackend` to save the result to bitmap files | image, rusttype, font-kit | Yes | 671 | svg\_backend | Enable `SVGBackend` Support | None | Yes | 672 | bitmap\_gif| Opt-in GIF animation Rendering support for `BitMapBackend`, implies `bitmap` enabled | gif | Yes | 673 674 - Font manipulation features 675 676 | Name | Description | Additional Dependency | Default? | 677 |----------|------------------------------------------|-----------------------|----------| 678 | ttf | Allows TrueType font support | font-kit | Yes | 679 | ab_glyph | Skips loading system fonts, unlike `ttf` | ab_glyph | No | 680 681 `ab_glyph` supports TrueType and OpenType fonts, but does not attempt to 682 load fonts provided by the system on which it is running. 683 It is pure Rust, and easier to cross compile. 684 To use this, you *must* call `plotters::style::register_font` before 685 using any `plotters` functions which require the ability to render text. 686 This function only exists when the `ab_glyph` feature is enabled. 687 ```rust,ignore 688 /// Register a font in the fonts table. 689 /// 690 /// The `name` parameter gives the name this font shall be referred to 691 /// in the other APIs, like `"sans-serif"`. 692 /// 693 /// Unprovided font styles for a given name will fallback to `FontStyle::Normal` 694 /// if that is available for that name, when other functions lookup fonts which 695 /// are registered with this function. 696 /// 697 /// The `bytes` parameter should be the complete contents 698 /// of an OpenType font file, like: 699 /// ```ignore 700 /// include_bytes!("FiraGO-Regular.otf") 701 /// ``` 702 pub fn register_font( 703 name: &str, 704 style: FontStyle, 705 bytes: &'static [u8], 706 ) -> Result<(), InvalidFont> 707 ``` 708 709 - Coordinate features 710 711 | Name | Description | Additional Dependency |Default?| 712 |---------|--------------|--------|------------| 713 | datetime | Enable the date and time coordinate support | chrono | Yes | 714 715 - Element, series and util functions 716 717 | Name | Description | Additional Dependency |Default?| 718 |---------|--------------|--------|------------| 719 | errorbar | The errorbar element support | None | Yes | 720 | candlestick | The candlestick element support | None | Yes | 721 | boxplot | The boxplot element support | None | Yes | 722 | area\_series | The area series support | None | Yes | 723 | line\_series | The line series support | None | Yes | 724 | histogram | The histogram series support | None | Yes | 725 | point\_series| The point series support | None | Yes | 726 727 - Misc 728 729 | Name | Description | Additional Dependency |Default?| 730 |---------|--------------|--------|------------| 731 | deprecated\_items | This feature allows use of deprecated items which is going to be removed in the future | None | Yes | 732 | debug | Enable the code used for debugging | None | No | 733 734 735 ## FAQ List 736 737 * Why does the WASM example break on my machine ? 738 739 The WASM example requires using `wasm32` target to build. Using `cargo build` is likely to use the default target 740 which in most of the case is any of the x86 target. Thus you need add `--target=wasm32-unknown-unknown` in the cargo 741 parameter list to build it. 742 743 * How to draw text/circle/point/rectangle/... on the top of chart ? 744 745 As you may have realized, Plotters is a drawing library rather than a traditional data plotting library, 746 you have the freedom to draw anything you want on the drawing area. 747 Use `DrawingArea::draw` to draw any element on the drawing area. 748 749 * Where can I find the backend code ? 750 751 Since Plotters 0.3, all drawing backends are independent crate from the main Plotters crate. 752 Use the following link to find the backend code: 753 754 - [Bitmap Backend](https://github.com/plotters-rs/plotters-bitmap.git) 755 - [SVG Backend](https://github.com/plotters-rs/plotters-svg.git) 756 - [HTML5 Canvas Backend](https://github.com/plotters-rs/plotters-canvas.git) 757 - [GTK/Cairo Backend](https://github.com/plotters-rs/plotters-cairo.git) 758 759 * How to check if a backend writes to a file successfully ? 760 761 The behavior of Plotters backend is consistent with the standard library. 762 When the backend instance is dropped, [`crate::drawing::DrawingArea::present()`] or `Backend::present()` is called automatically 763 whenever is needed. When the `present()` method is called from `drop`, any error will be silently ignored. 764 765 In the case that error handling is important, you need manually call the `present()` method before the backend gets dropped. 766 For more information, please see the examples. 767 768 769 <style> 770 img { 771 display: block; 772 margin: 0 auto; 773 max-width: 500px; 774 } 775 .galleryItem { 776 width: 250px; 777 display: inline-block; 778 } 779 .galleryImg { 780 max-width: 100%; 781 } 782 .galleryText { 783 text-align: center; 784 } 785 </style> 786 787 788 */ 789 pub mod chart; 790 pub mod coord; 791 pub mod data; 792 pub mod drawing; 793 pub mod element; 794 pub mod series; 795 pub mod style; 796 797 /// Evaluation Context for Rust. See [the evcxr crate](https://crates.io/crates/evcxr) for more information. 798 #[cfg(feature = "evcxr")] 799 pub mod evcxr; 800 801 #[cfg(test)] 802 pub use crate::drawing::{check_color, create_mocked_drawing_area}; 803 804 #[cfg(feature = "palette_ext")] 805 pub use palette; 806 807 /// The module imports the most commonly used types and modules in Plotters 808 pub mod prelude { 809 // Chart related types 810 pub use crate::chart::{ChartBuilder, ChartContext, LabelAreaPosition, SeriesLabelPosition}; 811 812 // Coordinates 813 pub use crate::coord::{ 814 cartesian::Cartesian2d, 815 combinators::{ 816 make_partial_axis, BindKeyPointMethod, BindKeyPoints, BuildNestedCoord, GroupBy, 817 IntoLinspace, IntoLogRange, IntoPartialAxis, Linspace, LogCoord, LogScalable, 818 NestedRange, NestedValue, ToGroupByRange, 819 }, 820 ranged1d::{DiscreteRanged, IntoSegmentedCoord, Ranged, SegmentValue}, 821 CoordTranslate, 822 }; 823 824 #[allow(deprecated)] 825 pub use crate::coord::combinators::LogRange; 826 827 #[cfg(feature = "chrono")] 828 pub use crate::coord::types::{ 829 IntoMonthly, IntoYearly, RangedDate, RangedDateTime, RangedDuration, 830 }; 831 832 // Re-export the backend for backward compatibility 833 pub use plotters_backend::DrawingBackend; 834 835 pub use crate::drawing::*; 836 837 // Series helpers 838 #[cfg(feature = "area_series")] 839 pub use crate::series::AreaSeries; 840 #[cfg(feature = "histogram")] 841 pub use crate::series::Histogram; 842 #[cfg(feature = "line_series")] 843 pub use crate::series::LineSeries; 844 #[cfg(feature = "point_series")] 845 pub use crate::series::PointSeries; 846 #[cfg(feature = "surface_series")] 847 pub use crate::series::SurfaceSeries; 848 849 // Styles 850 pub use crate::style::{BLACK, BLUE, CYAN, GREEN, MAGENTA, RED, TRANSPARENT, WHITE, YELLOW}; 851 852 #[cfg(feature = "full_palette")] 853 pub use crate::style::full_palette; 854 855 #[cfg(feature = "colormaps")] 856 pub use crate::style::colors::colormaps::*; 857 858 pub use crate::style::{ 859 AsRelative, Color, FontDesc, FontFamily, FontStyle, FontTransform, HSLColor, IntoFont, 860 IntoTextStyle, Palette, Palette100, Palette99, Palette9999, PaletteColor, RGBAColor, 861 RGBColor, ShapeStyle, TextStyle, 862 }; 863 864 // Elements 865 pub use crate::element::{ 866 Circle, Cross, Cubiod, DynElement, EmptyElement, IntoDynElement, MultiLineText, 867 PathElement, Pie, Pixel, Polygon, Rectangle, Text, TriangleMarker, 868 }; 869 870 #[cfg(feature = "boxplot")] 871 pub use crate::element::Boxplot; 872 #[cfg(feature = "candlestick")] 873 pub use crate::element::CandleStick; 874 #[cfg(feature = "errorbar")] 875 pub use crate::element::ErrorBar; 876 877 #[cfg(feature = "bitmap_backend")] 878 pub use crate::element::BitMapElement; 879 880 // Data 881 pub use crate::data::Quartiles; 882 883 // TODO: This should be deprecated and completely removed 884 #[cfg(feature = "deprecated_items")] 885 #[allow(deprecated)] 886 pub use crate::element::Path; 887 888 #[allow(type_alias_bounds)] 889 /// The type used to returns a drawing operation that can be failed 890 /// - `T`: The return type 891 /// - `D`: The drawing backend type 892 pub type DrawResult<T, D: DrawingBackend> = 893 Result<T, crate::drawing::DrawingAreaErrorKind<D::ErrorType>>; 894 895 #[cfg(feature = "evcxr")] 896 pub use crate::evcxr::evcxr_figure; 897 898 // Re-export tier 1 backends for backward compatibility 899 #[cfg(feature = "bitmap_backend")] 900 pub use plotters_bitmap::BitMapBackend; 901 902 #[cfg(feature = "svg_backend")] 903 pub use plotters_svg::SVGBackend; 904 } 905 906 /// This module contains some useful re-export of backend related types. 907 pub mod backend { 908 pub use plotters_backend::DrawingBackend; 909 #[cfg(feature = "bitmap_backend")] 910 pub use plotters_bitmap::{ 911 bitmap_pixel::{BGRXPixel, PixelFormat, RGBPixel}, 912 BitMapBackend, 913 }; 914 #[cfg(feature = "svg_backend")] 915 pub use plotters_svg::SVGBackend; 916 } 917 918 #[cfg(test)] 919 mod test; 920
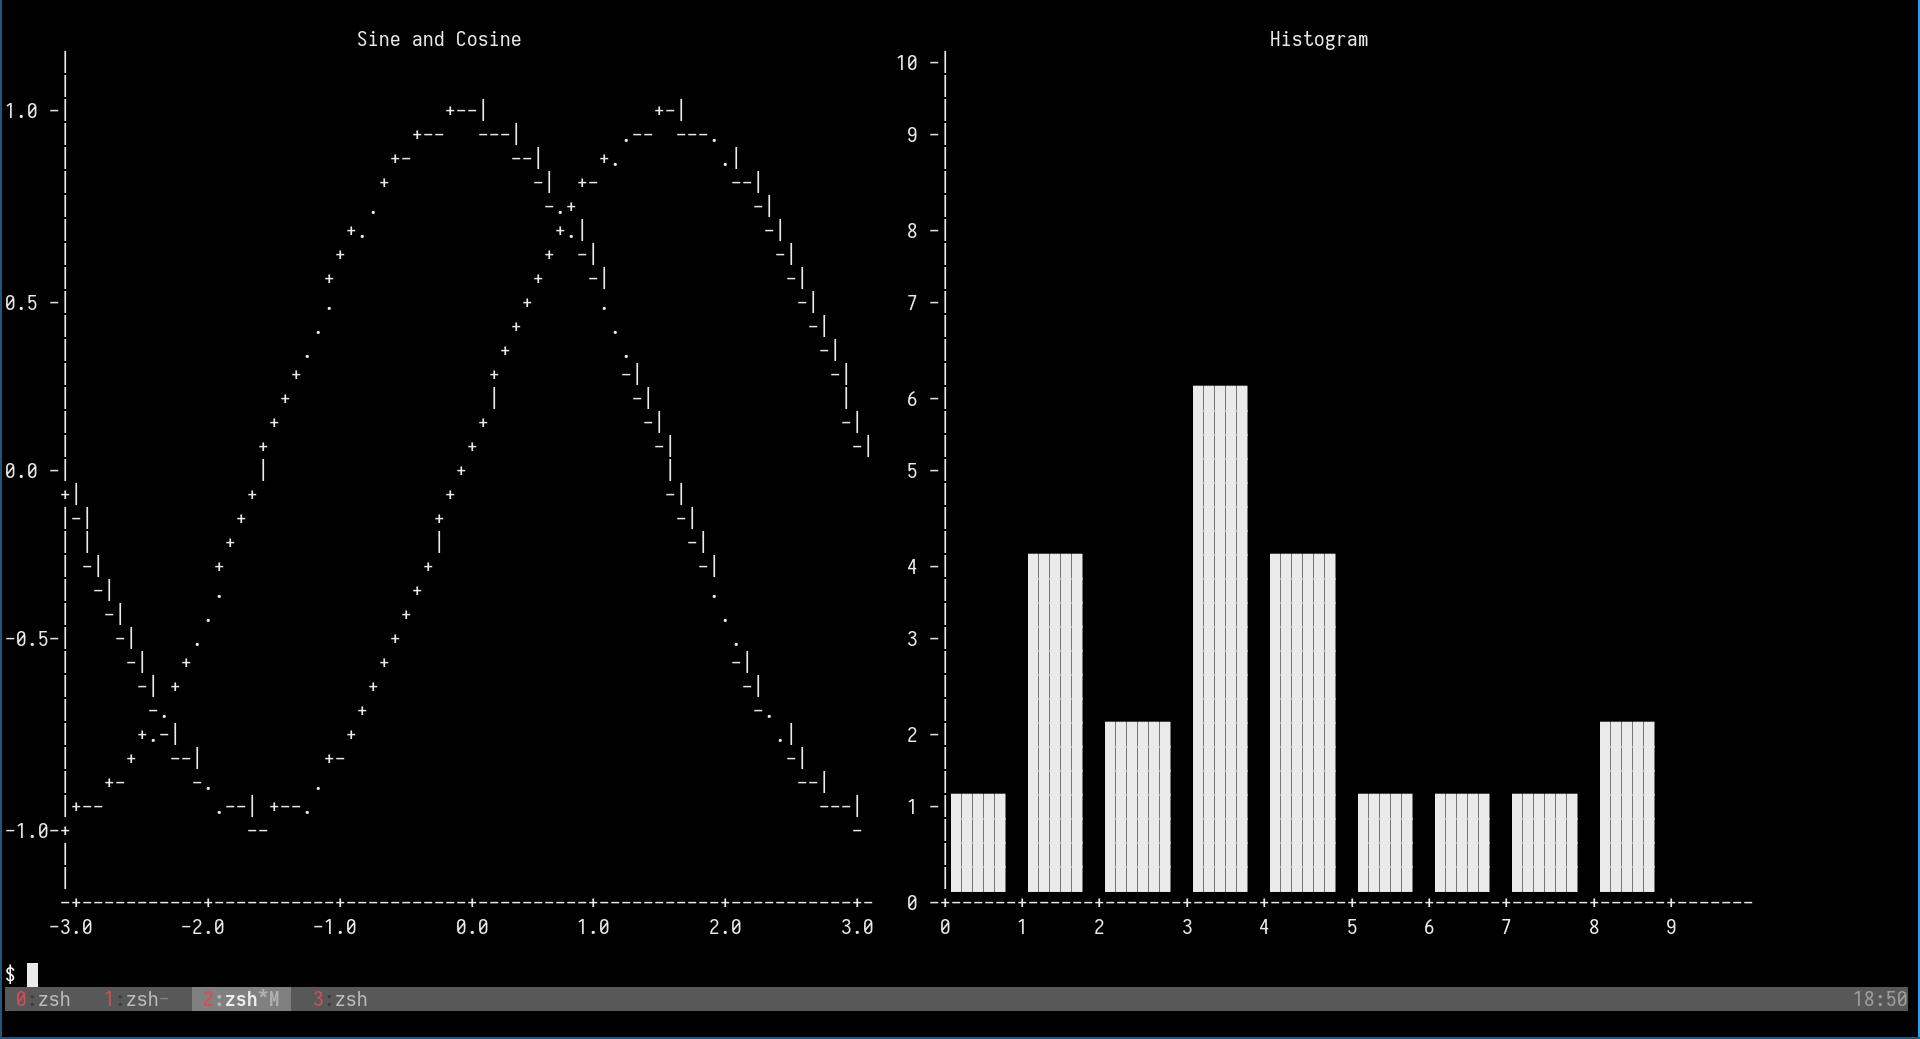
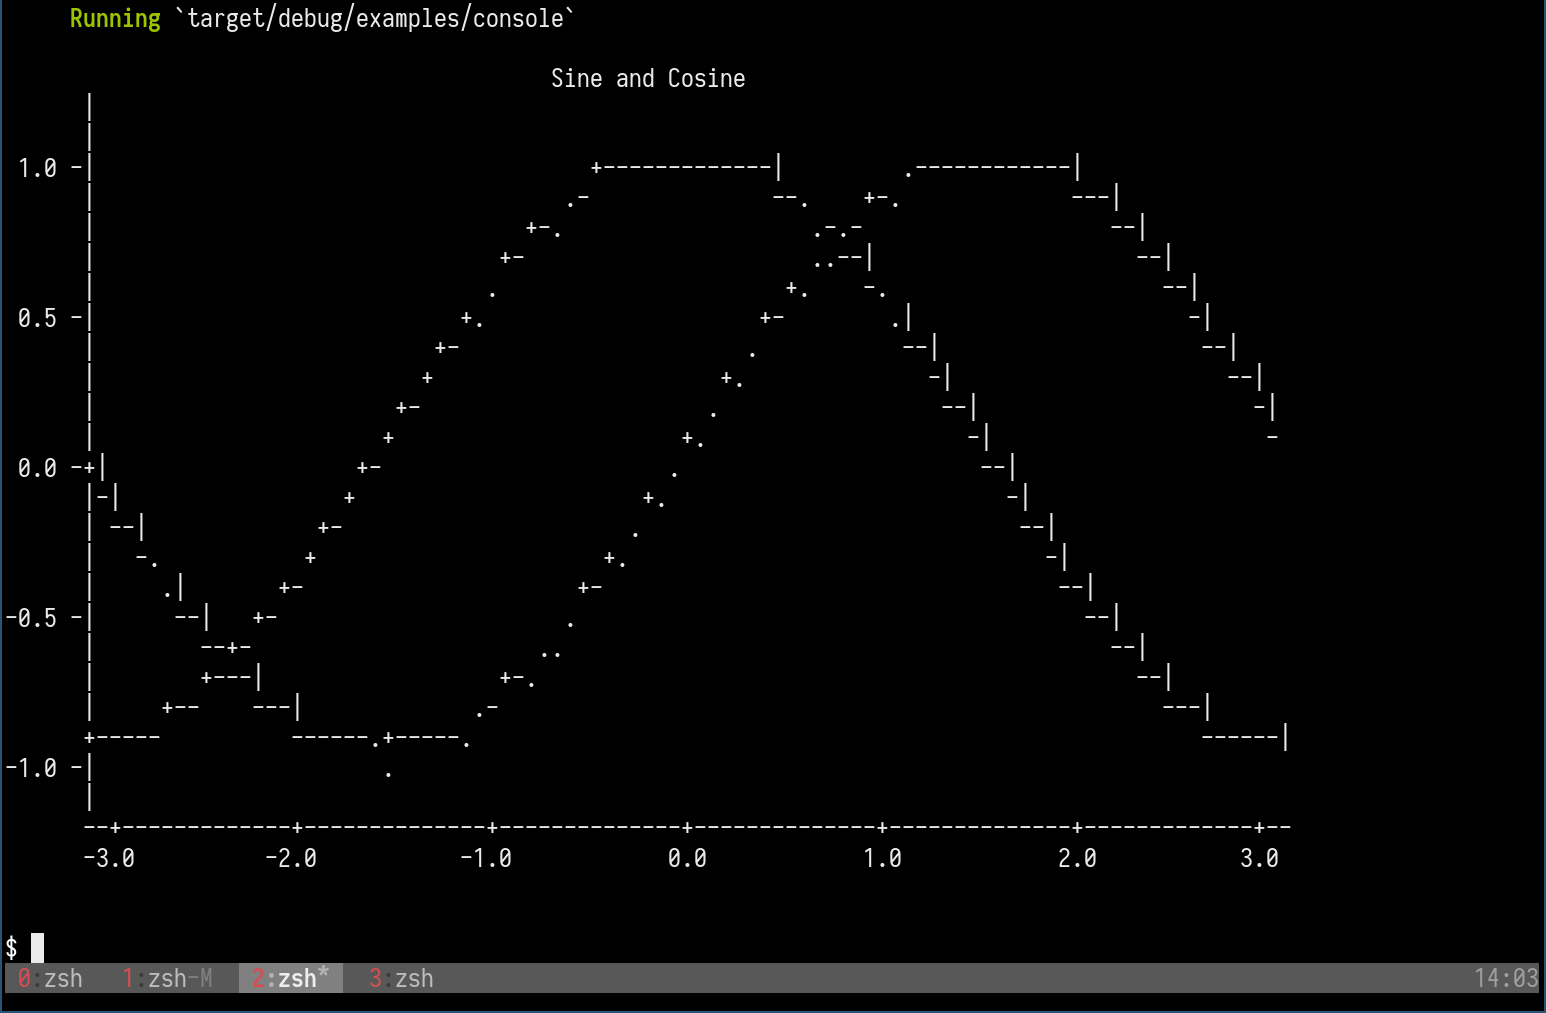
)
)
)
)
)
)